This blog is subject the DISCLAIMER below.

Wednesday, June 25, 2008

Microsoft WS08 Virtualization Hyper-V RC now available

I've received that from Kareem Salah(IT Professional Audience Marketing Manager Microsoft Egypt)

I am very happy to announce that we have released the Release Candidate (RC) version of Hyper-V (Windows Server 2008 Virtualization Technology). This release candidate is a feature-complete version of Hyper-V.

You can download the update for Hyper-V RC here (http://www.microsoft.com/downloads/details.aspx?FamilyId=DDD94DDA-9D31-4E6D-88A0-1939DE3E9898&displaylang=en ) and experience the improved stability, usability and performance and also test the support for additional guest operating systems. Kindly note that Hyper-V will be integrated with your existing Windows Server 2008 x64 as an update to simplify the integration process.

Key Features of Hyper-V:
· New and Improved Architecture. New 64-bit micro-kernelized hypervisor architecture enables Hyper-V to provide a broad array of device support methods and improved performance and security.
· Broad OS Support. Broad support for simultaneously running different types of operating systems, including 32-bit and 64-bit systems across different server platforms, such as Windows, Linux, and others.
· Symmetric Multiprocessors (SMP) Support. Ability to support up to four multiple processors in a virtual machine environment enables you to take full advantage of multi-threaded applications in a virtual machine.
· Network Load Balancing. Hyper-V includes new virtual switch capabilities. This means virtual machines can be easily configured to run with Windows Network Load Balancing (NLB) Service to balance load across virtual machines on different servers.
· New Hardware Sharing Architecture. With the new virtual service provider/virtual service client (VSP/VSC) architecture, Hyper-V provides improved access and utilization of core resources, such as disk, networking, and video.
· Quick Migration. Hyper-V enables you to rapidly migrate a running virtual machine from one physical host system to another with minimal downtime, leveraging familiar high-availability capabilities of Windows Server and System Center management tools.
· Virtual Machine Snapshot. Hyper-V provides the ability to take snapshots of a running virtual machine so you can easily revert to a previous state, and improve the overall backup and recoverability solution.
· Scalability. With support for multiple processors and cores at the host level and improved memory access within virtual machines, you can now vertically scale your virtualization environment to support a large number of virtual machines within a given host and continue to leverage quick migration for scalability across multiple hosts.
· Extensible. Standards-based Windows Management Instrumentation (WMI) interfaces and APIs in Hyper-V enable independent software vendors and developers to quickly build custom tools, utilities, and enhancements for the virtualization platform.

Core Scenarios for Hyper-V
Hyper-V provides a dynamic, reliable, and scalable virtualization platform combined with a single set of integrated management tools to manage both physical and virtual resources, enabling you to create an agile and dynamic data center. Hyper-V enables:
· Server Consolidation
Businesses are under pressure to ease management and reduce costs while retaining and enhancing competitive advantages, such as flexibility, reliability, scalability, and security. The fundamental use of virtualization to help consolidate many servers on a single system while maintaining isolation helps address these demands. One of the main benefits of server consolidation is a lower total cost of ownership (TCO), not just from lowering hardware requirements but also from lower power, cooling, and management costs. Businesses also benefit from server virtualization through infrastructure optimization, both from an asset utilization standpoint as well as the ability to balance workloads across different resources. Improved flexibility of the overall environment and the ability to freely integrate 32-bit and 64-bit workloads in the same environment is another benefit.
· Business Continuity and Disaster Recovery
Business continuity is the ability to minimize both scheduled and unscheduled downtime. That includes time lost to routine functions, such as maintenance and backup, as well as unanticipated outages. Hyper-V includes powerful business continuity features, such as live backup and quick migration, enabling businesses to meet stringent uptime and response metrics.Disaster recovery is a key component of business continuity. Natural disasters, malicious attacks, and even simple configuration problems like software conflicts can cripple services and applications until administrators resolve the problems and restore any backed up data. Leveraging the clustering capabilities of Windows Server 2008, Hyper-V now provides support for disaster recovery (DR) within IT environments and across data centers, using geographically dispersed clustering capabilities. Rapid and reliable disaster and business recovery helps ensure minimal data loss and powerful remote management capabilities.
· Testing and Development
Testing and development are frequently the first business functions to take advantage of virtualization technology. Using virtual machines, development staffs can create and test a wide variety of scenarios in a safe, self-contained environment that accurately approximates the operation of physical servers and clients. Hyper-V maximizes utilization of test hardware which can help reduce costs, improve life cycle management, and improve test coverage. With extensive guest OS support and checkpoint features, Hyper-V provides a great platform for your test and development environments.
· Dynamic Data Center
Hyper-V, together with your existing system management solutions, such as Microsoft System Center, can help you realize the dynamic data center vision of providing self-managing dynamic systems and operational agility. With features like automated virtual machine reconfiguration, flexible resource control, and quick migration, you can create a dynamic IT environment that uses virtualization to not only respond to problems, but also to anticipate increased demands.

To install and configure Hyper-V, please review the Installation Guide here:
http://www.microsoft.com/windowsserver2008/en/us/hyperv-install.aspx

.. more.

Monday, June 23, 2008

Java Reporting – Part 4

Today's article is the last one in the java reporting series. Through parts 1, 2, and 3 we have discovered JasperReports architecture, declarative file construction, integration with live parameters, and finally working with iReport as designing tool. Those topics are only the basic introduction to java reporting world and this series is not meant to cover the whole features of JasperReports, you can consider it as the kick start in the reporting field where every new report is supposed to contain new cases that formalize your experience.

There was a time when charts' reports were considered as one of the imaginary features that clients have dreamt with for a long nights, but they also were suffering from usual nightmares when dream reach to the payment point, that is a result of a quote says "When development is hard; the customer should pay for that too". Thanks to open-source community that age went and will not come back again, today as a result of cumulative work in open charts' libraries and engines we became able to build a graphical chart reports in a smooth and easy way without the usual headache of plotting and rendering the results, which is also –unfortunately- rescued the customer financial plans from the definite fate.

In toady's article we are going to create a Line chart report as sample application of chart reports with JasperReport and iReport. Actually there are a lot of graphs you can work with through jasperReports, e.g. Pie, 3D Pie, Bar, 3D Bar, XY Bar, XY Line, XY Area, Time Series, Multi-axis, Meter, etc. I chose Line chart report for our sample as it is a good example to cover 3-variables graphs.

Dependencies:
As we mentioned before, most of reporting tools depend mainly on the chart engines and frameworks for plotting and rendering the resulted graphs, our tool -JasperReports- depends on a very popular, powerful and flexible open source charting library called JFreeChart.
So to get ready you need to download JFreeChart Library from here:
http://www.jfree.org/jfreechart/download.html ,
Extract the compressed file and add these libraries to your project classpath:
jfreechart-1.0.xx.jar (jfreechart-1.0.10.jar)
jcommon-1.0.xx.jar (jcommon-1.0.13.jar)

Report Definition
Database architecture:
-- ITEM
ITEM_ID NUMBER(5) NOT NULL
CATEOGRY_ID NUMBER(5) NOT NULL
ITEM_NAME VARCHAR2(50) NOT NULL
ITEM_DESCIPTION VARCHAR2(200)
ITEM_AMOUNT NUMBER(5) NOT NULL

--STOCK_OPERATIONS
ITEM_ID NUMBER(5) NOT NULL
OPERATION_TYPE NUMBER(1) NOT NULL
OPERATION_DATE DATE NOT NULL
AMOUNT NUMBER(10) NOT NULL

Report Result: report should draw a graph line -for each item- that represents the total amount (on the y-axis) of in-operations divided by the days (on the x-axis).
Report Query:
[SELECT item.ITEM_NAME, to_date(OPERATION_DATE,'dd-mm-yyyy') operationdate, SUM (stock.AMOUNT) amount
FROM STOCK_OPERATIONS stock, item
WHERE stock.ITEM_ID = item.ITEM_ID and stock.OPERATION_TYPE =1
GROUP BY item.ITEM_NAME, to_date(OPERATION_DATE,'dd-mm-yyyy')
ORDER BY operationdate , item.ITEM_DATE ]

The above query will retrieve the graph result for all items in the stock; we can narrow it down by adding date period condition or specify item id in run-time search criteria as declared previously in part 3.

Step-by-Step
1- Open iReport.
2- From the toolbox choose ChartTool and draw your graph control in on of the bands that don't get repeated in the same page (background, pageHeader, ColumnHeader).
3- From the pop-up window choose your chart type (Line Chart) as shown in the image below.
4- Add the report query from Data -> Report query
5- Open Chart Properties (Right-click your chart and choose Chart Properties) and open Chart Data tab, then open the inside tab called Details and press the Add button, as shown:
6- The Expressions in the shown dialog are:
-Series Expression: represents the graph lines.
-Category Expression: represents X-axis values.
-Value Expression: represents Y-axis values.

7- Axis labels, lines colors, delimiters shapes, legends and other graph properties can be handled from the Chart properties dialog.

Now execute the report in JRViewer and watch the results:


That's all, you'r report is ready to get linked with application and exported to whatever format you want without any modification in your code –except the jrxml file name-.

Here we reach to the end of this series, it didn't cover everything in reporting field but I wish it could help as introduction for beginners and for those need kick start.

Thanks and best regards,
Hossam Sadik
23-Jun-2008

For detailed topics about JasperReports please refer to these books:
The Definitive Guide to JasperReports by Teodor Danciu and Lucian Chirita
JasperReports for Java Developers by David R. Heffelfinger


.. more.

Friday, June 20, 2008

dotNetWork.org 5th gathering

Date:

28 June 2008,
12:00 - 16:00

Attendance is FREE =)

Speakers
Yasser Makram
Software Architect - Santeon.

Mohamed Samy
Technical Architect, MVP - ITWorx.

Agenda
12:00 - 13:30:
Delivering Rich User Experience Applications using Silverlight 2
by Yasser Makram.

13:30 - 14:00: Coffee Break

14:00 - 15:30:
Patterns and Anti-patterns of SOA
by Mohamed Samy.

15:30 - 16:00: Lunch

Location:

Canadian International College, @ "El-Tagamo3 El-5ames"

Busses will be available at: Nady El-Sekka (11:00 AM - 11:30 AM)
Please be there before 11:30 coz we will leave on time..


For those who wanna keep tuned with further news about this event & other upcoming events of the dotnetwork.org user group, please check the following links:

Yahoo!Group:
http://tech.groups.yahoo.com/group/dotnetworkorg/

Facebook Event:
http://www.facebook.com/event.php?eid=15523324683
You'd better join the above event if you have a facebook account so we can roughly estimate the attendees count..

Facebook Fan Page:
http://www.facebook.com/pages/netWorkorg/13135685545

Facebook Group:
http://www.facebook.com/group.php?gid=2409268236

Please don't hesitate to contact me if you have any further questions..
See u on the gathering ;)

.. more.

Tuesday, June 17, 2008

IComparable Interface.

From The name, this Interface used for comparison. This is the implementation of this interface:

C#:

public interface IComparable
{
int CompareTo(object o);
}


vb.net:

Public Interface IComparable
    Function CompareTo(ByVal o As Object) As Integer
End Interface


The result of this function is Integer; it returns 0 in similarity, -1 when the first one is smaller and 1 when larger .

Now we don't need to know who is larger, let’s assume that we have car class, something like that:

C#:

class Car
{

string Name;
int year;
}

vb.net:

Class Car
    Private Name As String
    Private year As Integer
End Class


Now we need to sort the cars depends on the creation year, our first step it to implement IComparable interface.

C#:

class Car:IComparable
{

string Name;
int year;
}


vb.net:

class Car:IComparable
{

string Name;
int year;
}


Next, we should write an implementation to CompareTo function, something like that:

c#:

int IComparable.CompareTo(object obj)
{
Car temp = (Car)obj;
if(this.year > temp.year)
return 1;
if(this.year < temp.year)
return -1;
else
return 0;
}


vb.net:

Private Function CompareTo(ByVal obj As Object) As
Integer Implements IComparable.CompareTo
    Dim temp As Car = DirectCast(obj, Car)
    If Me.year > temp.year Then
        Return 1
    End If
    If Me.year < temp.year Then
        Return -1
    Else
        Return 0
    End If
End Function


Anyway, -1 is equals to -100 in return value, this function work with any negative number referring to smaller, any positive number also is accepted instead of 1.

Sort Function:

Assume we have array of numbers, in this case some code like that is applicable.

c#:

Array.Sort(myNumbers);


vb.net:

Array.Sort(myNumbers)


But if we have array of cars, this will cause error, except if we implementing IComparable interface. in this case the array.sort() will use CompareTo function to sort all array elements. This is better solution than using another function for check and sorting. It is also more readable for people who work with you or read your code.

.. more.

Tuesday, June 10, 2008

Java Reporting – Part 3

Through the previous articles (Part 1 and Part 2) we've covered the jasper introduction, architecture, environment, and finally we managed to run a sample report.

Today we're going to work with visual report design tools and enhance our sample application to receive run-time parameters.

As we mentioned before JasperReports and other reporting tools were introduced to facilitate the reporting development cycle, but for end-developers working with declarative files –xml- is usually considered as two-sided coin. Although they are more flexible and popular, the overhead of designing report layout entirely by xml tags deserve reconsidering about using reporting tool.

Thanks to open-source community we don't need to design our report layout through declarative files by ourselves anymore, a visual design tools were introduced to the open-source reporting engines. iReport and JasperAssistant are a good examples for JasperReports visual designer they had completed the missing block in constructing robust java reporting tools. As example of using design tools we'll explore iReport and continue our tutorial application with it.

First you need to download the executable file from here, there are many versions you can download anyone –personally I use v2.0.4–. Install the executable file, start iReport and let's work in the previous article sample report:

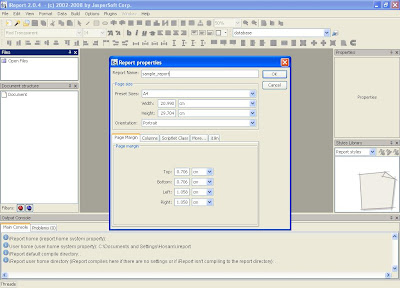
1- Open File menu -> New Document

2- After creating the empty report we need to set our data-source connection to test the report in the design time, to set the connection go to Data menu --> Connection/Data Sources, click on 'New' button, choose your datasource type from the list –in my case its 'Database JDBC connection'-, and fill the connection parameters with your arguments.

3- Now we have an active connection to the data-source, next step is to define the report query we'll use to fetch the report results. From Data menu --> choose Report Query, and then enter the report query as shown:

You can notice the fields marked by red circle, they are generated fields from your SQL query projection that will be used as report result.

4- Now let's design our report layout, at the column header band we'll add to the report header as a Static Text element from the tools –the one marked by red circle-, then at the details band we'll add the dynamic data-source fields which are resulted from query projection, they can be added from the left panel 'Document structure' tree 'Fields' node –the one marked with blue circle-.

You may notice the three elements in the Document Structure panel: Parameters, Fields and Variables, those are the heart of the JaperReports they control every thing regarding the report behavior and results, lets clarify them in more detail:

  • Parameters: contain the arguments passed from the application code in run-time, we use it for building run-time search criteria and they are passed from code in the form of HashMap, written in xml by the following format: $P{REPORT_DATE}.
  • Fields: the dynamic result of the fields retrieved from data-source, they represent the report result, written in xml by the following format: $F{ITEM_NAME}.
  • Variables: they are two types, JasperReports built-in variables like (PAGE_NUMBER, PAGE_COUNT, COLUMN_COUNT… etc.), and there are the user defined variables which are used to perform more complicated operations on report results (calculations, summarizing, condition branching…etc.), they are written in xml by the following format: $V{COLUMN_NUMBER}.

5- Its time to test our report, iReport enables report designer to test his work on live data-source connection and different exporting format. From Build menu --> choose the exporting format you want, I'll choose JRViewer Preview, then choose 'Execute (with active connection)'. You should get the report result in the JRViewer as shown:

That was the first part of our lesson today; at the next part we'll modify our sample application to accept run-time search criteria, we will modify both the design file and the application code to be able to pass parameter contains the dynamic items amount limit we want search for, as shown in the following steps:

1- In the design file we'll add a new parameter and append it in the query where segment, right click on the Parameter node in the 'Document Structure' panel and choose 'add' --> 'Parameter', enter the parameter name, say "itemAmount" and choose type class (Integer), then update the query statement by replacing the where condition item_amount <= 100 with item_amount <= $P{itemAmount}.

2- At the code we need to update the parameter hashmap by adding an entry to it contains [key: parameter name, value: parameter value] as following:

// connection is the data source we used to fetch the data from
Connection connection = establishConnection();
// jasperParameter is a Hashmap contains the parameters
// passed from application to the jrxml layout

HashMap jasperParameter = new HashMap();

// put the search criteria you want
jasperParameter.put("itemAmount ",50);

// jrxml compiling process
jasperReport = JasperCompileManager.compileReport
("C://sample_report.jrxml");

// filling report with data from data source

jasperPrint = JasperFillManager.fillReport(jasperReport,jasperParameter, connection);

Run the application and you'll notice that results are filtered according to your search criteria.

Here we reach the end of our today's article. Next article is supposed to be the last one in the series, we'll cover the charts reports design & development in action.


Navigate the series: 1, 2, 3, 4

.. more.

Monday, June 09, 2008

Java Reporting - Part 2

Hey people .. Welcome back to Java Reporting series. For those who didn't read the introductory article; have a look here before we get started.

Today we're going to have a quick tour in JasperReport architecture, development lifecycle, report definition files, and finally we're going to set up our environment and start work in a sample application.


Architecture:

As shown in the above figure Jasper architecture is based on defined XML files which by convention have an extension of jrxml this file contains the report layout template. A lot of third-party design tools were produced to generate your jrxml file in a smooth way (like iReport or JasperAssistant)

Design file is supposed to be filled by report's result which is fetched from database, XML files, Java collection, Comma-separated values or Models. Jasper can communicate with those data-sources and more, it can merge any number of data-sources together and manipulates the results of any combinations. This communication goes through JDBC, JNDI, XQuery, EJBQL, Hibernate or existing Oracle PL/SQL. You also can define your own data-source class and pass it to jasper engine directly.

After defining your report design layout in jrxml format and determining your data source(s) jasper engine does the rest of work. It compiles your design file and fills it with results fetched from data-source and generates your report to the chosen exporting format (PDF, Excel, HTML, XML, RTF, TXT …, etc.)

Report Definition file structure (jrxml):

Jasper design file –jrxml- contains the following elements:

  • <jasperReport>: the root element.
  • <title>: its contents are printed only once at the beginning of the report
  • <pageHeader> - its contents are printed at the beginning of every page in the report.
  • <detail> - contains the body of the report, repeated by n number of results
  • <pageFooter> - its contents are printed at the bottom of every page in the report.
  • <band> - defines a report section, all of the above elements contain a band element as its only child element.

Only the root element is mandatory, the rest of elements are optional.

Environment:

To set up working environment we need to download JasperReport jar file from the following URL: http://sourceforge.net/project/showfiles.php?group_id=36382&package_id=28579
And add the following jars to your project classpath:

  • jasperreports-2.0.4.jar
  • commons-digester-1.7.jar
  • commons-collections-2.1.jar (commons-collections.jar)
  • commons-logging-1.0.2.jar
  • commons-beanutils.jar
  • iText-2.0.7.jar (used infor PDF exporting)

Sample application:
At this section we'll introduce a sample application that generates PDF, HTML and Excel files contain the results of our report which is built over Oracle database contains the following table:

ITEM

ITEM_ID ---- NUMBER(5) --- NOT NULL
CATEOGRY_ID ---- NUMBER(5) --- NOT NULL
ITEM_NAME ---- VARCHAR2(50) --- NOT NULL
ITEM_DESCIPTION ---- VARCHAR2(200)

ITEM_AMOUNT ---- NUMBER(5) ---- NOT NULL

Result: Report should retrieve the items with amount less than or equal 100 item.

We're going to divide the work into two steps:

1-Generate the report design (jrxml file).

2-Implement application that assigns data source, compiles jrxml file and exports result in the chosen format.

1- Designing report

First we create new text file and rename it to sample_report.jrxml, this file should contain the following XML tags.


<!DOCTYPE jasperReport PUBLIC
"//JasperReports//DTD Report Design//EN"
"http://jasperreports.sourceforge.net/dtds/jasperreport.dtd">

<jasperReport name="sample_report" >
<queryString>
<![CDATA[select item_name,item_amount from item
where item_amount <=100]]>
</queryString>
<field name="ITEM_NAME" class="java.lang.String"/>
<field name="ITEM_AMOUNT" class="java.math.BigDecimal"/>
<columnHeader>
<band height="28" isSplitAllowed="true">
<staticText>
<reportElement x="40" y="11" width="193" height="15" key="staticText-1"/>
<text>
<![CDATA[Item Name]]>
</text>
</staticText>
<staticText>
<reportElement x="330" y="11" width="193" height="15" key="staticText-2"/>
<text>
<![CDATA[Item Amount]]>
</text>
</staticText>
</band>
</columnHeader>

<detail>
<band height="27" isSplitAllowed="true">
<textField>
<reportElement x="47" y="6" width="173"
height="18" key="textField"/>
<textFieldExpression class="java.lang.String">
<![CDATA[$F{ITEM_NAME}]]>
</textFieldExpression>
</textField>
<textField >
<reportElement x="330" y="6" width="100"
height="18" key="textField"/>
<textFieldExpression class="java.math.BigDecimal">
<![CDATA[$F{ITEM_AMOUNT}]]>
</textFieldExpression>
</textField>
</band>
</detail>
</jasperReport>

The above XML file consists of the following main sections that defining report behavior and layout:

  • <queryString>: contains the SQL statement which retrieves the report result.
  • <field name>: defines the resulted fields from the query, and give them name to reuse them into the report body [they are case-sensitive].
  • <staticText>: contains the header titles "Item Name" in <![CDATA[Item Name]]> tag format.
  • <textFieldExpression>: defines the appearance of result field.
  • $F{ITEM_NAME}: is a variable contains the value of Query result predefined field in the tag <field name>.

Once we finished the report design file, save it in C:\ directory.

2- Implementing report service:
- Create a new java project.
- Import the jars listed in environment section to your project libraries.
- Create new class and import the following packages

import java.sql.Connection;
import java.sql.DriverManager;
import java.sql.SQLException;

import java.util.HashMap;

import net.sf.jasperreports.engine.JRException;
import net.sf.jasperreports.engine.JRExporterParameter;
import net.sf.jasperreports.engine.JasperCompileManager;
import net.sf.jasperreports.engine.JasperExportManager;
import net.sf.jasperreports.engine.JasperFillManager;
import net.sf.jasperreports.engine.JasperPrint;
import net.sf.jasperreports.engine.JasperReport;
import net.sf.jasperreports.engine.export.JRXlsExporter;


- Define the data source, in my case it's an oracle connection and established by JDBC as following:

public static Connection establishConnection()
{
Connection connection = null;
try
{
Class.forName("oracle.jdbc.driver.OracleDriver");
String oracleURL = "jdbc:oracle:thin:@localhost:1521:mySID";
connection = DriverManager.getConnection(oracleURL,"username","password");
connection.setAutoCommit(false);
}
catch(SQLException exception)
{
exception.printStackTrace();
}
return connection;

}

Finally, the core code for compiling, filling and exporting the results in the following sequence:

- Define jasper objects that will hold report template, compiled files, and result files.

/* JasperReport is the object
that holds our compiled jrxml file */

JasperReport jasperReport;
/* JasperPrint is the object contains
report after
result filling process */
JasperPrint jasperPrint;


- Create a connection to my data-source; initialize the report parameter into empty HashMap then compile our jrxml file into JasperReport object and finally fill the JasperPrint object by data from data-source connection.

// connection is the data source we used to fetch the data from
Connection connection = establishConnection();

// jasperParameter is a Hashmap contains the parameters
// passed from application to the jrxml layout

HashMap jasperParameter = new HashMap();

// jrxml compiling process
jasperReport =
JasperCompileManager.compileReport
("C://sample_report.jrxml");

// filling report with data from data source

jasperPrint = JasperFillManager.fillReport(jasperReport,jasperParameter, connection);

- Last segment of code is responsible for exporting the result files into different formats

// exporting process
// 1- export to PDF

JasperExportManager.exportReportToPdfFile(jasperPrint, "C://sample_report.pdf");

// 2- export to HTML
JasperExportManager.exportReportToHtmlFile(jasperPrint, "C://sample_report.html" );

// 3- export to Excel sheet
JRXlsExporter exporter = new JRXlsExporter();
exporter.setParameter(JRExporterParameter.JASPER_PRINT, jasperPrint);
exporter.setParameter(JRExporterParameter.OUTPUT_FILE_NAME, "C://simple_report.xls" );

exporter.exportReport();

Congratulation, you've just managed to generate your first jasper report in 3 different file formats at C:\\
directory (shown in the image below):

- sample_report.html
- sample_report.pdf
- sample_report.xls


Here we reach the end of today's article, next article we will cover the following points:
1- Using design tool (iReport) to generate robust and smooth jrxml file.
2- Create run-time search criteria and passing parameters to report.

Navigate the series: 1, 2, 3, 4

.. more.

Thursday, June 05, 2008

Java Reporting: JasperReports

One of the purposes of software industry is to automate the routinely activities and summarize the data in decision supporting format which is commonly known by reports, that’s the reason why customers used to consider software as the wizard stick that will turn their usual mess into charming charts, graphs and visualized datagram's. On the other side, reports are considered as the developers' usual nightmare; you can obviously notice the misery look over the victim's face when get assigned to the reports module.

When comes to reports, customers like to change their mind rapidly "Please, can we add new search criteria !!?", "Oh, That result need a little bit change to fit what we dreamt with", "If only we can group the results by clients country" and "Dear, the graph colors hurt users eye".


We can summarize the usual troubles in report development in the following points:

  • Core changes: it's usual to modify/add report core logic to reflect business changes or usability enhancements.
  • Results exporting: There is a wide set of formats to export your report to, such as: HTML, text, PDF, MS Excel, RTF, ODT, Comma-separated values, XML or image.
  • Complicated reports sub-reports and cross-tabs reports are good example.
  • Charts reports: visual chart e.g. Graph, Pie, 3D Pie, Bar, XY Line, Scatter, Meter and Time series.

A lot of frameworks, tools, libraries, and 3rd parties applications were introduced to facilitate the reporting process and to remove the overhead of the mentioned points, our topic today is about one of them .. JasperReport.
JasperReport is a well-known open source java reporting engine that gained wide popularity in few years. Unlike other tools –e.g. Crystal Reports- it's based on java and doesn't have its own expression syntax.

Let's read what's written in wikipedia about JasperReports features:

  • PDF, HTML, Microsoft Excel, RTF, ODT, CSV and XML files. The engine allows report definitions to include charts, with the rendering provided by the JFreeChart library which supports many chart layouts, such as Pie, Bar, Stacked Bar, Line, Area, Scatter Plot, Bubble, and Time series.
  • Multiple sources can be merged together. The data can be retrieved from defined data sources such as JDBC, CALS Table Models, JavaBeans, EJBQL, XML, Hibernate, and Comma-separated values, and additional data sources can be added to the JasperReports framework by plugging in a custom JRQueryExecuter. An extension is available to use Oracle PL/SQL stored procedures as a data source.
  • Scriptlets may accompany the report definition, which the report definition can invoke at any point to perform additional processing. The scriptlet is built using Java, and has many hooks that can be invoked before or after stages of the report generation, such as Report, Page, Column or Group.
  • Sub-reports.

As a victim developer I've passed through the report development iterations by its whole faces (designing, implementing, changing, changing, changing and more changing), but I was little more lucky to work with Jasper through this long cycle in sub-reports, Crosstabs, Charts and graphs.

The main difficulty I faced while working with jasper was the shortage of resources and tutorials, which is a common problem among other developers so I hope to transfer my personal experience with JasperReports in more detailed articles.

Continue to the next posts: 2, 3, 4

References:

http://www.jasperforge.org/jaspersoft/opensource/business_intelligence/jasperreports/index.html
http://en.wikipedia.org/wiki/Jaspersoft
http://www.javaworld.com/javaworld/jw-09-2002/jw-0920-opensourceprofile.html


.. more.

FileSystemWatcher


FileSystemWatcher Class is very benefit when trying to monitor some files and inform user or program when any change occurs, all events are listed in NotifyFilters enum, this is the list of events can be handled by this:

public enum NotifyFilters {
Attributes, CreationTime, DirectoryName, FileName, LastAccess, LastWrite, Security, Size,
}

Now we need to declare functions to be called when some event occurred, this function will run through this delegate:


void MyNotificationHandler(object source, FileSystemEventArgs e)


Only rename event will run through this delegate:

void MyNotificationHandler(object source, RenamedEventArgs e)


Now we will start console application to monitor files, this application will run till user press q, this program will monitor all *.txt files in c:\ folder:


C#:


FileSystemWatcher watcher = new FileSystemWatcher();

// monitor files at:
watcher.Path = @"c:\";

// monitor files when
watcher.NotifyFilter = NotifyFilters.LastAccess NotifyFilters.LastWrite NotifyFilters.FileName NotifyFilters.DirectoryName;

// watch files of type
watcher.Filter = "*.txt";

// watch events:
watcher.Created += new FileSystemEventHandler(OnChanged);
watcher.Deleted += new FileSystemEventHandler(OnChanged);

watcher.EnableRaisingEventys = true;

Console.WriteLine("Press 'q' to quit app.");

while (Console.Read() != 'q') ;

vb.net:


Dim watcher As New FileSystemWatcher()


' monitor files at:
watcher.Path = "c:\"

' monitor files when
watcher.NotifyFilter = NotifyFilters.LastAccess Or NotifyFilters.LastWrite Or NotifyFilters.FileName Or NotifyFilters.DirectoryName

' watch files of type
watcher.Filter = "*.txt"

' watch events:
AddHandler watcher.Created, AddressOf OnChanged
AddHandler watcher.Deleted, AddressOf OnChanged

watcher.EnableRaisingEvents = True

Console.WriteLine("Press 'q' to quit app.")

While Console.Read() <> "q"C

End While


As you seen, we call OnChanged function every event occurs, so we can implement this function to print this event and its time like that:


C#:


static void OnChanged(object source, FileSystemEventArgs e)

{

Console.WriteLine("File Changed, File Path: {0} , Change: {1}, DateTime: {2}", e.FullPath, e.ChangeType,DateTime.Now.ToString());

}

vb.net:


Private Shared Sub OnChanged(ByVal source As Object, ByVal e As FileSystemEventArgs)

Console.WriteLine("File Changed, File Path: {0} , Change: {1}, DateTime: {2}", e.FullPath, e.ChangeType, DateTime.Now.ToString())

End Sub


Now, this is screen shot of application when delete .txt file and create it again.


.. more.